The Trends page shows whether your chatbot is getting better or worse over time, and how quickly your team is fixing what audits find. Use it to prove that your fixes worked, and to spot a slide in quality before it costs you sales or support tickets.
Before you start
- Any workspace member who can view reports can open Trends, including Viewers.
- You need at least one completed audit. A trend line becomes useful after two or more audits of the same chatbot. See Run an audit and watch results live, or set up Scheduled audits so new data arrives automatically.
- How far back you can look depends on how long your plan keeps reports.
Step by step
1. Open Trends
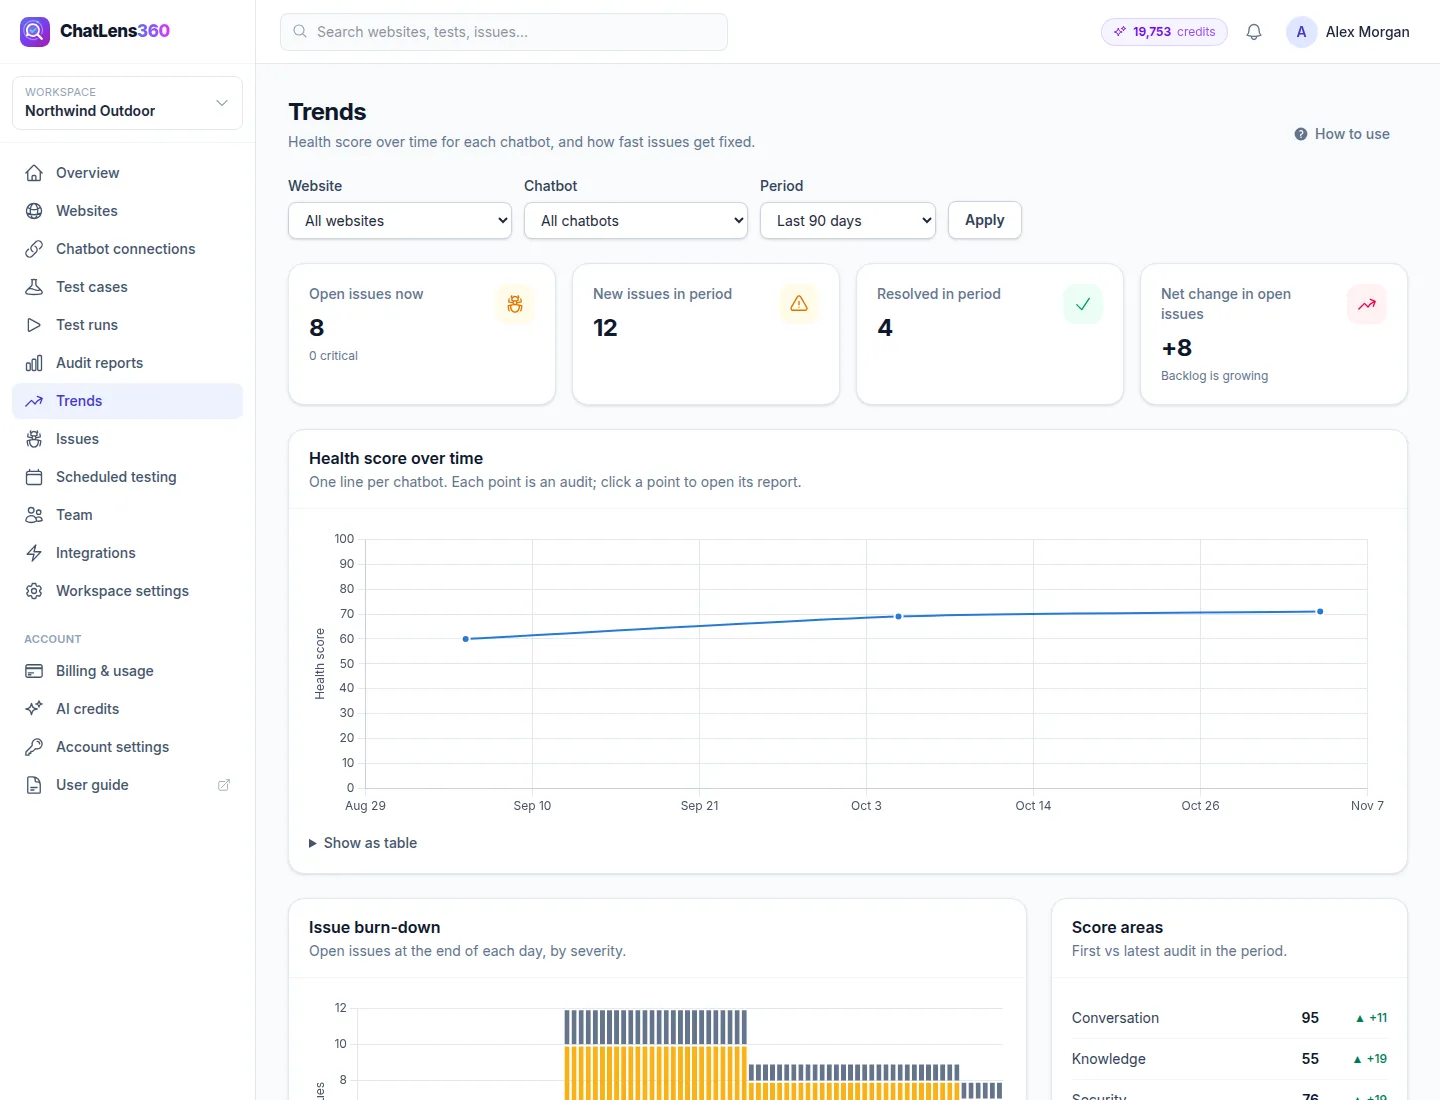
In the left sidebar, click Trends. The page opens on the last 90 days for all websites and chatbots in the workspace.
2. Filter the view
At the top of the page, choose:
- Website: one site, or All websites.
- Chatbot: one chatbot connection, or All chatbots. When you pick a website, this list shows only that site's chatbots.
- Period: Last 30 days, Last 90 days, Last 180 days or Last 365 days.
Click Apply to update the page. If your plan keeps reports for a shorter time than the period you chose, a note tells you the date the view starts on.
3. Read the four summary numbers
The cards across the top answer the question "is our backlog under control?":
- Open issues now: issues still open today, with the number of critical ones underneath. Click the card to go to Issues.
- New issues in period: issues found by audits during the period.
- Resolved in period: issues your team closed.
- Net change in open issues: the difference between open issues now and at the start of the period. The hint says Backlog is shrinking or flat or Backlog is growing.
4. Follow the health score over time
The Health score over time chart draws one line per chatbot. Each point is an audit, scored from 0 to 100. Hover over a point to see its date and score, and click it to open that audit's report.
A dashed line means the chatbot connection has since been deleted, so you keep its history.
Click Show as table under the chart to see each chatbot's number of Audits, its First and Latest score, and the Change between them.
5. Check the issue burn-down
The Issue burn-down chart stacks open issues by severity (critical, high, medium, low and info) at the end of each day for short periods, or each week for longer ones. As you mark issues fixed, the bars shrink. Show as table lists the same numbers by date.
6. Compare score areas
The Score areas card compares the first and latest audit in the period for each area of the score. An up arrow means the area improved; a down arrow means it got worse. This tells you which part of your chatbot to work on next.
Tips
- Run an audit right after you change your chatbot's prompt or knowledge, then look at Trends. A rising line is the clearest proof that a change paid off.
- Watch Net change in open issues in your weekly team meeting. If the backlog is growing, prioritize critical and high issues first.
- Filter to one chatbot when you test several, so a weak bot is not hidden by a strong one in the overall picture.
- Use the Score areas card to choose your next focus: the area with the lowest latest score or the biggest drop usually has the biggest business impact.
- Share the trend with stakeholders by opening the latest report from a chart point and sharing that report. See Read your report and share it.
Troubleshooting
- The chart says "No audits in this period": run an audit, or choose a longer Period.
- The burn-down says "No issues in this period": no audits found problems during the period, or the issues were found before it started. Widen the period to check.
- The view starts later than the period I chose: your plan keeps reports for a shorter time. Upgrading extends your report history. See Plans, billing and AI credits.
Related guides
Still stuck? Contact us and we will help, or let our team set it up and fix it for you.